
Decade Eyewear: +345.6% revenue growth. +94.0% marketing efficiency.
An eyewear brand, stronger product demand and a clearer view of performance. Explore Decade’s August–October 2026 growth: revenue up 345.6% year over year, with marketing efficiency up 94.0%.
Services
Paid media and performance analysis
Platforms
Meta, Google & Shopify reporting
Revenue growth
Marketing efficiency
More growth from a larger media investment
Decade Eyewear | August–October 2026 | Commentary by Jason Heiber, Morpheus Media
For a growing eyewear brand, increasing the advertising budget is a meaningful commitment. The question is whether sales can grow fast enough to make that larger investment work harder.
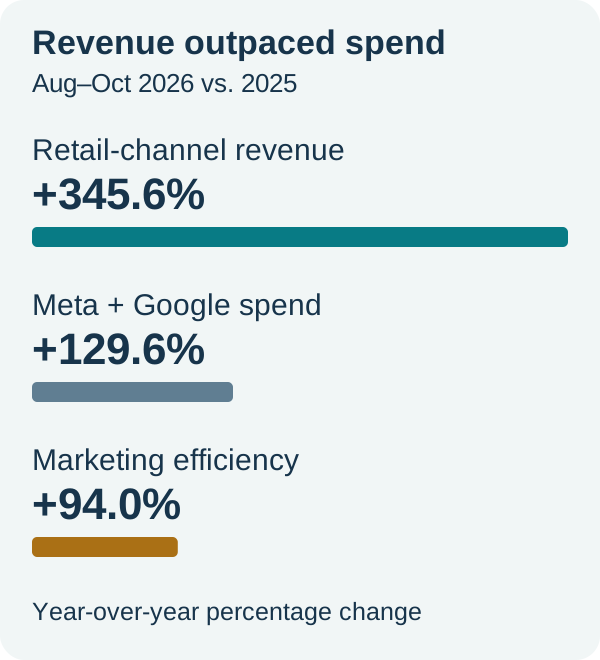
Across August–October 2026, Decade’s selected Shopify retail-channel revenue increased 345.6% year over year. Recorded Meta and Google spend increased 129.6%. Marketing efficiency—the relationship between that revenue and media spend—improved 94.0%.
Revenue grew faster than the advertising budget. That is the central result of this follow-up to our earlier Decade case study.
“Growing revenue is one part of the job. We also want to understand how much we have to spend to get there, and whether the business is becoming more efficient as it grows.” — Jason Heiber, Morpheus Media
The challenge: understanding what deserves more investment
Decade’s growth involved more than an advertising account. Creative, the shopping experience, a product collaboration and stock availability all belonged in the discussion. Making the next budget decision required a view of the whole business.
Our earlier work with Decade documented founder-led advertising, a virtual showroom approach and improvements to the shopping experience. This case study examines the later reporting period and the questions its results raised: which creative should the brand develop further, how did product demand influence sales, and where could the team invest next?
Connect the creative, the product and the numbers
Read the business result alongside the ad platforms
Platform reporting helps explain campaign performance. Store revenue helps explain the business outcome. Keeping those views connected gives the team a more useful basis for discussing growth.
For this case, the revenue comparison uses the same selected Shopify channels in both years: Online Store, Facebook & Instagram, and Shop. POS and other channels sit outside that selection. That distinction matters for a brand with sales beyond its online store.
Marketing efficiency ratio, or MER, is selected retail-channel revenue divided by recorded Meta and Google spend. The 94.0% improvement describes the change in that ratio across the full period.
Make the next creative decision specific
In the November performance review, the team examined a reporting view that brings together the same creative’s performance across campaigns within a chosen date range. Decade wanted to understand which assets were working and what to make more of.
That is a productive creative conversation: identify the asset, understand the product it supports, and examine its performance over a consistent period. It gives the next brief something concrete to build on.
“The useful question is what we should make more of. To answer it, we need to look at the creative, the product and the sales together, with a clear date range behind the numbers.” — Jason Heiber, Morpheus Media
Account for product demand and availability
Decade’s team also reported a strong response to a recent collaboration, including colorway sellouts. That context belongs alongside the advertising results: a compelling product and an engaged audience can affect store sales and platform-reported performance at the same time.
Stock visibility helps shape what happens next. Once a product becomes unavailable, the team needs to understand which alternatives it can support and how the next creative brief should respond.
The November review documents that discussion and reporting workflow. The results below cover August–October; they do not isolate the impact of individual creative changes or the collaboration.
The results, with the full period in view
Across the reporting period, Decade combined 345.6% revenue growth with a 129.6% increase in recorded media spend. The resulting 94.0% MER improvement shows that the relationship between revenue and media investment strengthened.
Each month adds context
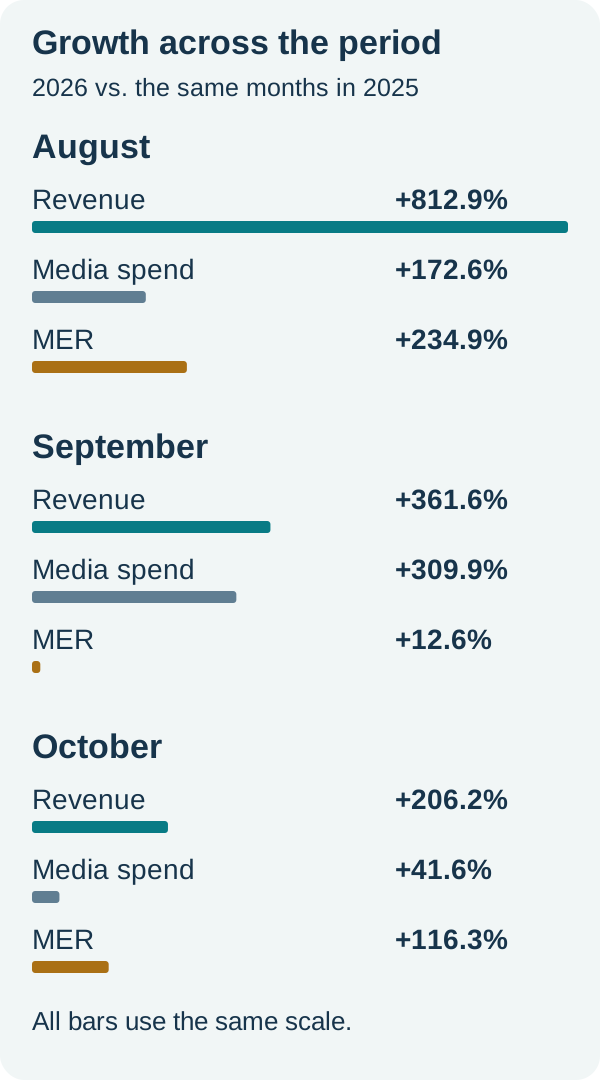
- August: revenue +812.9%; media spend +172.6%; MER +234.9%.
- September: revenue +361.6%; media spend +309.9%; MER +12.6%.
- October: revenue +206.2%; media spend +41.6%; MER +116.3%.
All three months showed year-over-year growth in revenue and MER, but the size of those gains varied. August’s large revenue percentage reflects a smaller prior-year base. September’s spending growth tracked much closer to its revenue growth. October showed a stronger efficiency gain than September.
Looking at the whole window gives a more useful picture than treating the strongest month as the expected result.
“The result worth paying attention to is that revenue grew faster than media spend. The next step is understanding which parts of that progress we can repeat, and what depended on the product launch or the inventory available at the time.” — Jason Heiber, Morpheus Media
What growing ecommerce brands can take from this
Decade’s results illustrate why the next growth decision should bring creative performance, product demand and stock availability into the same conversation. A rising revenue figure is encouraging. Understanding how it relates to spending—and what influenced it—makes it more useful.
For Morpheus Media, that means asking practical questions: which assets deserve another iteration, which products can support more demand, and does the store-level picture justify the next media investment?
How we measured the result
Source: Morpheus Reporting Dashboard, retrieved November 10, 2026. Comparison: August–October 2026 against the same complete calendar months in 2025, in the client’s reporting timezone. Revenue uses the selected Shopify retail channels described above. Media spend includes recorded Meta and Google amounts.
The period’s MER improvement is calculated from the revenue and spend totals for each period, not by averaging the monthly percentage changes. All displayed performance figures are percentage changes, rounded to one decimal place.
This is an observational comparison. Product demand, promotions, inventory and other marketing activity can influence the result. MER measures revenue relative to recorded media spend; it does not establish profit, new-customer acquisition cost or incremental advertising lift.
Find the next opportunity in your ecommerce business
Bring your creative, channel mix and store performance into one conversation. Talk to Jason Heiber and the Morpheus Media team about where your next growth opportunity may be.
FREE AUDIT
Request a FREE audit within your industry to find out how fast we could potentially grow your company's sales and profits.
Don't take our word for it, take theirs!
We understand your requirements and deliver growth, no fluff.

Matthew Rosenfeld

Stephen Murphy

Elizabeth Grojean
“Amazing experience with Jason and his team. They are absolutely experts in terms of paid social advertising and paid search. They helped us build out amazing landing pages and drove phenomenal results for our brands. Couldn't recommend them more highly. If you want to drive results - go with Jason and the Digital Marketing NYC team.”
Matthew Rosenfeld
“Personalized service from experts in the field and spot on performance under pressure. They have been helpful in identifying how to convert business in the digital landscape for financial services.”
Stephen Murphy
“Our company has worked with Jason for several months - we've seen amazing results in ads with up to 78x ROAS (even, 100x ROAS, which seems hard to believe but is true). He's knowledgeable about all facets of digital marketing and how they complement each other, e.g TOF, MOF and BOF, including SEO and email, and stays up to date on best practices. Unlike other agencies this team has been truly collaborative and interested in understanding our business on a deep level. Ten stars.”
Elizabeth Grojean
Ready to claim your digital real estate?
Paid ads are the fastest way to grow your company and to get in-front of your competition. Get a quote today!


Browse our Packages
Find out if Google Ads or Social Media Ads are best to start your journey.
Browse Packages